Volume Profile Trading: The Cornerstone of a Solid Trade plan.
Volume profile, the closest to a holy grail the market will give you.
Welcome everyone, this will be the first of many trading lessons we will release on volume profile trading. In this lesson we will cover some key concepts and typical trade examples that you can use in your day to day trading.
Before we get started with the more advanced side of Volume Profile let’s cover the basics. What is Volume Profile? Volume Profile is another way to view volume, typical volume is read on a time axis, but VP (I am going to abbreviate Volume profile as VP moving forward) puts volume on a price axis. An easy way to remember it is regular volume is vertical, VP is horizontal.
VP looks at how much volume is traded on each price point, these price points can be changed by the trader. You can look at volume per tick, per point, or whatever way you wish. VP will show you a “profile” of this volume by laying out horizontal bars that visualize how much volume has traded at that price level. So for example if 1000 contracts traded at the $500 level it would show that in the profile, it does not matter if 500 of those contracts were traded at 930am and 500 contracts were traded at 4pm, all that matters is the volume and price it traded at, time is irrelevant.
As this VP develops it will typically fall into a few shapes. The most common shapes are “D” “b” “P” “B” and a trend profile also known as a thin profile (a thin profile is one that doesn’t fall into any other shape because it has many smaller nodes and long periods of low volume nodes).
Let’s cover a few more terms before we get into the trade examples;
Nodes: There are high volume nodes (HVNs) and low volume nodes (LVNs). These are the clusters of prices on the profile. Price levels that trade many contracts will develop large HVNs. Price levels that reject volume will develop LVNs.
Point of Control (POC): The POC is the highest value bar on the VP. This is the level that has traded the most volume for whatever time that VP covers. If the VP covers one day’s worth of price action it will be the highest volume traded price point of that day.
Value Area: The value area is a zone that is created using the POC and standard deviations. Typically people like the Value Area to have 68-70% of the volume for that VP.
Value Area High (VAH): The VAH is as it sounds, it is the highest price point of the Value Area. This level is key for targets and trade entries using VP trading techniques.
Value Area Low (VAL): The VAL is as it sounds, it is the lowest price point of the Value area. This level is key for targets and trade entries using VP trading techniques.
Tails: The remaining part of the profile that is outside the Value Area. For example, if the VAH stops at $500 but the high of day is $600 then it would have a $100 upper tail. If the VAL is $200 and the low of day is $100 then it would have a $100 lower tail. Tails are important because they signify where value is falling off, creating excess, finding significant demand in the opposing direction, and other concepts that we will cover in our VP lessons.
There are other terms, but this will be sufficient to continue our lesson for today.
Now that you understand the basics, let us cover some typical patterns and trade examples. In this first article we will focus on the D Shape Profile, in future articles we will discuss the other shapes and techniques, so stay tuned.
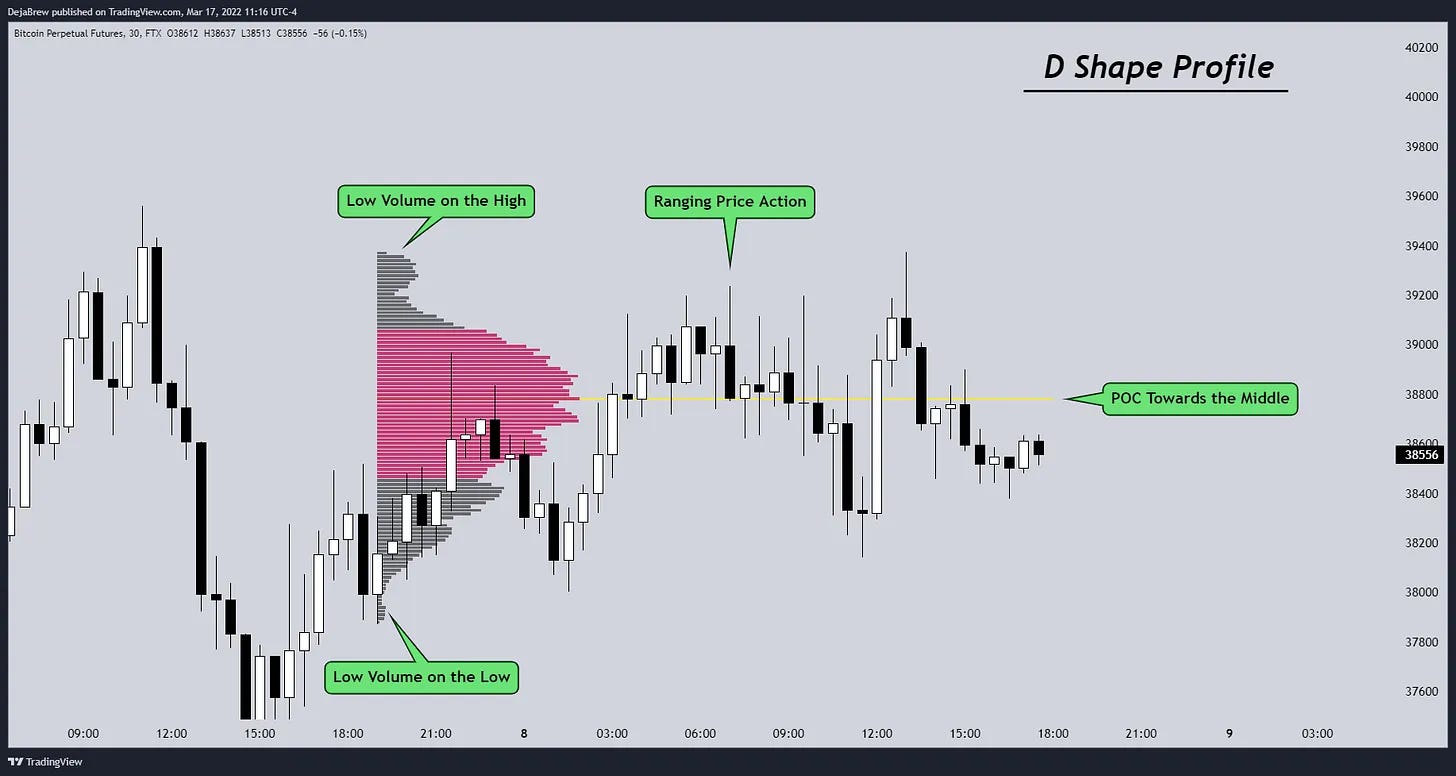
D Shape Profile: A D Shape profile signifies that the market is in Balance. Balance is when the market is in complete agreement that this price is fair, there is no imbalance towards the high (P Shape) or towards the low (b Shape) and the POC is very close to the middle of the day. Balanced days usually show up in accumulation or distribution patterns or after a major breakout or breakdown when price is cooling off. Balance is a low volatility environment and mean reversion strategies thrive in D Shaped days.
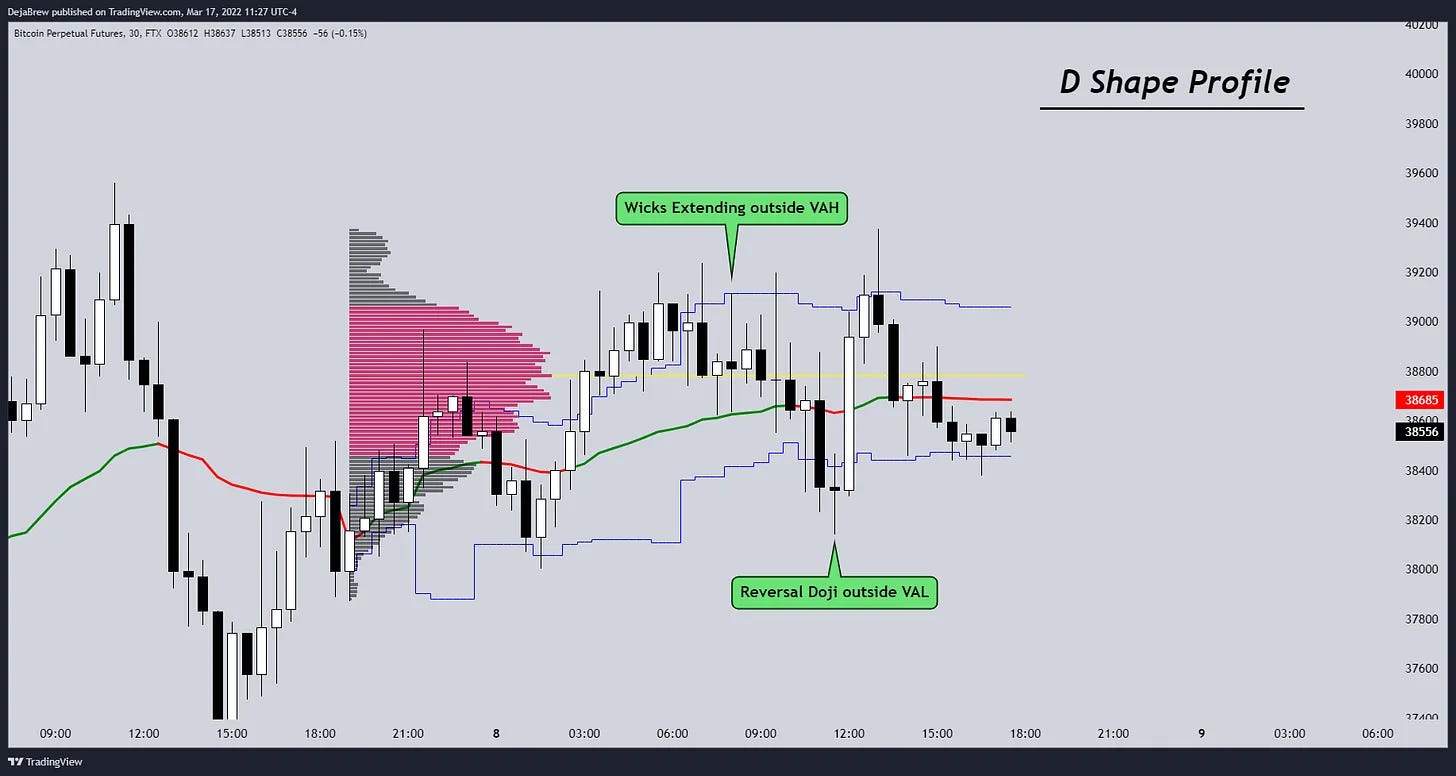
Typical trades during a D shape profile are going to be mean reversion trades. These types of trades look for when price is extended outside the VAH or VAL and look to target the POC or VWAP. Showing examples of these trades is difficult because these profiles shift throughout the day, so a D shape at the end of the day might of been a P shape at the start.
To best show this I have turned on the Developing Value Area (Blue Lines). With these lines we can see how the value area was developing throughout the day. Typically when the Value Area lines are very sideways you are balancing out and exits outside the top or bottom can quickly be reverted back to the POC or VWAP.
Targets should always be the POC and VWAP or opposing Value Area Level. Stops are tricky because you have to watch your R-R, sometimes a proper stop will give a horrible risk to reward and will have to be tightened or the trade avoided completely. Stops should be placed above strong resistance nodes for shorts and below strong support nodes for longs
The main thing to remember with D shaped days is that price is rotating, it is balancing out and finding value that the market agrees on. What happens is the POC becomes that value they agree on and any movement away from that POC is seen as unfair value and gets rejected. The POC then begins to act as a very strong magnet and pulls price back into it, but typically it doesn’t stop there, it will continue to the other side of the value area. If the rejection began at the VAH it will begin to fall back into the POC then rotate down to the VAL. If it began at the VAL it will break the POC and rotate into the VAH, rinse and repeat.
The teal lines are the developing value area. The arrows are showing where the reversals back into value are occurring.
These rotations will happen until the market no longer agrees on the fair value. They will then look to break balance by building up value outside of the value area. I like to look at this in two phases, building value and protecting value. When it breaks the value area then begins to build it’s node outside the value area this is building value, then when it pushes away from that node it will sometimes quickly pullback into that node and bounce off it, this is protecting value. Once these two phases happen it will begin to find new value.
Even before these two phases come into play you want to watch out for failed rotations. Failed rotations will be the first warning sign that price wants to find new value. We know that a standard rotation is from VAH to VAL or vice versa, so a failed rotation is when price hits the VAH but fails to make it back to the VAL or hits the VAL but fails to make it back to the VAH before breaking out of value.
Typically failed rotations will finish 30-50% of the rotation, but then fail at VWAP or POC then retrace, but sometimes they are very weak and don’t even make it back to the POC as seen in the above example.
We will end this lesson there, but don’t worry we will have more of these lessons coming up very soon. Our next VP lesson will be on imbalanced profiles, the “P” and “b” shaped profiles. These are some of our favorite days because they offer great trades. They offer sweeps, traps, long lasting trailing trades, and more…
I hope you all enjoyed this lesson, please hit that like button and if you have any questions feel free to leave them in the comments below. I will see you all in our next lesson.


What software are you using to generate the lines that show fluctuating levels of VAH, VAL during the current trading session? My Ninja 8 does not do that.
Excellent content Deja